Independent Samples T Test using SPSS

Blog, Thesis writing

Chi-Square test in SPSS

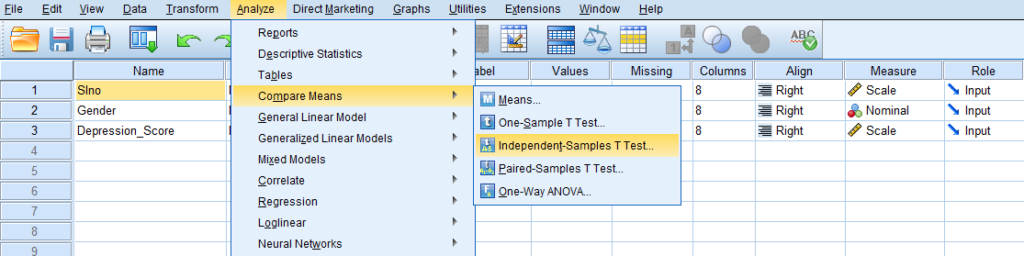
Independent-Samples T Test is used to compare the means of two groups. The Independent Samples T Test is also known as Two Samples T Test.

Independent Samples T Tests have the following hypotheses.

Null hypothesis: The means of two populations are equal.

Alternative hypothesis: The means of two populations are not equal.

Assumptions

1. The dependent variable should be continuous.

2. Independent variables should be of two categories.

3. The dependent variable should be approximately normally distributed.

4. Homogeneity of variances is required, i.e., variances of the dependent variable should be equal.

5. Significant outliers should not be present.

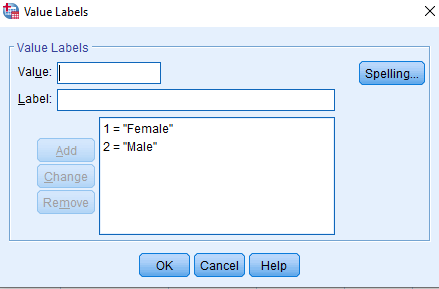
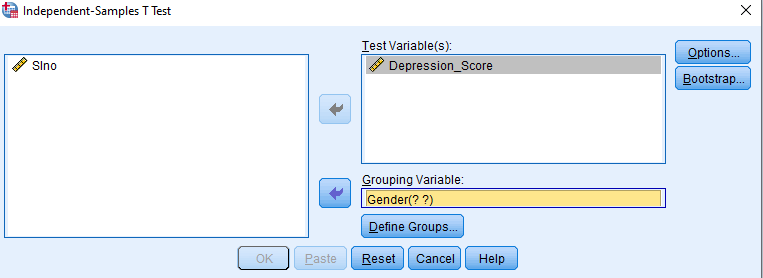
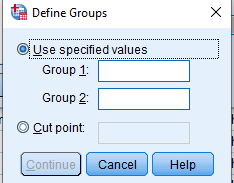
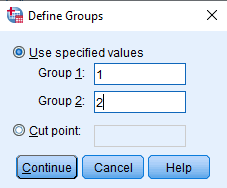
Here, we have taken Depression score as the independent variable and Gender as the dependent variable. We labelled 1 as ‘Female’ and 2 as ‘Male’.

In SPSS, Independent Samples T Test is found in Analyze > Compare Means > Independent Samples T Test.

Then, we will get Independent Samples T Test dialog box.

We have to add the dependent variable (Depression Score) in the ‘Test Variable(s)’ box and add the independent variable (Gender) in the ‘Grouping Variable’ box.

Then, we have to define the groups for the Grouping Variable (Gender). Click on the ‘Define Groups’ dialog box.

Enter 1 in the ‘Group 1’ box and enter 2 in the ‘Group 2’ box (We have labelled 1 as ‘Female’ and 2 as ‘Male’).

Click on ‘Continue’ and ‘Ok’.

Output of Independent Samples T Test

First, we will get the ‘Group Statistics’ table. 

‘Group Statistics’ table gives descriptive statistics for the two groups of the dependent variable (Gender).

Here, column N is the total number of observations, column Mean gives the mean of the dependent variable for each level of the independent variable, column Std. Deviation gives the standard deviation of the dependent variable for each level of the independent variable, and column Std. Error Mean gives the standard error of the mean.

Then, we will get the ‘Independent Samples Test’ table.

Here, column F gives the Levene’s Test statistic. Levene’s Test is used to check the assumption of homogeneity of variances. Null hypothesis for Levene’s Test is that the variances are equal across all samples. Here, Sig (2 tailed) (p value) value is 0.000 and thus, we reject the null hypothesis.

Column t gives the t statistics under two different assumptions – ‘Equal variances assumed’ and ‘Equal variances not assumed’. The column df gives the degrees of freedom. Here, we can see that group means are significantly different because the value in Sig (2 tailed) is 0.000 (less than 0.05). The column Mean Difference gives the difference between the means, Std. Error Difference is the estimated standard deviation of the difference between the sample means and 95% Confidence Interval of the Difference gives the lower and upper bounds of the confidence interval for the mean difference. In our example, male participants had a significantly higher depression when compared to female participants.

Data: Independent_sample_t_test_Data.sav

“Rehoboth Academic Services” is a premium institute supporting PhD & Master’s Thesis since 2013. We offer editing, proofreading, paper preparation, statistical analysis, formatting and plagiarism checking services. We have helped more than 10000+ research scholars in most of the subjects and universities across the globe in the last eleven years. We also conduct workshops on Art of Thesis Writing, Academic Integrity, Research Paper writing, Systematic Review writing, Increasing citation score, SPSS Foundation & Advanced, Jamovi, JASP, SmartPLS and SEM workshops. If you need our assistance please call + 91 9731988227, +91 9741871657.

Are you interested to attend our Workshops?

Click here to see our future workshop schedule…

Leave a Reply

Your email address will not be published.