Linear Regression Analysis in SPSS

Blog, Thesis writing

Linear Regression Analysis in SPSS

Linear Regression attempts to model the relationship between two variables by fitting a linear equation to the observed data. Linear Regression is a supervised learning algorithm. Here, we are predicting the dependent variable by using the independent variable.
Assumptions
1. Dependent variable should be continuous.
2. A linear relationship must exist between two variables.
3. Observations need to be independent.
4. Data should show Homoscedasticity.
5. Data should follow Normality.
6. No significant outliers should be present.
Here, we have taken Uric acid as the dependent variable and Meat consumption as the independent variable.
In SPSS, Linear Regression is found in Analyze > Regression > Linear

Then, we will get ‘Linear Regression’ dialog box.

We have to add the dependent variable (Uric acid) in the ‘Dependent’ box and add the independent variable (Meat consumption) in the ‘Block 1 of 1’ box.

In the ‘Statistics’ dialog box, we have to add ‘Estimates’ and ‘Confidence intervals’, and add ‘Model fit’ and ‘Descriptives’ in the ‘Regression Coefficients’ group. 

Click on ‘Continue’ and ‘Ok’.

Output of Linear Regression Analysis

‘Descriptive Statistics’ provide the mean and standard deviation for the dependent (Uric acid) and the independent (Meat consumption) variables.

First, we will get the ‘Model Summary’ table.

Here, R value of 0.971 represents the correlation. The R square value of 0.943 indicates how much of total variation in the dependent variable (Uric acid) can be explained by the independent variable. Here, 94.3% can be explained.

Then, we will get ‘ANOVA’ table.

Here, Sig. value (p value) is less than 0.05. Therefore, the regression model statistically and significantly predicts the outcome variable.

Then, we will get ‘Coefficients’ table.

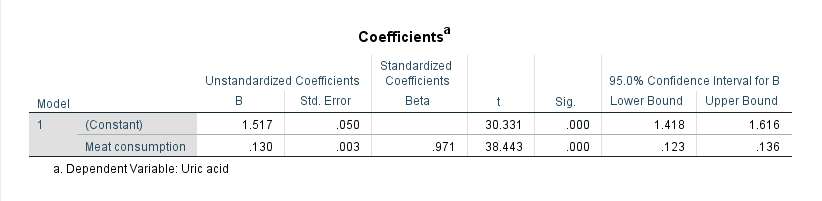
B value is the regression coefficient, which is defined as the change occurring in the dependent variable for every unit change occurring in the independent variable. In our example, the impact of Meat consumption has B = 0.130 and p value = 0.003. This indicates that when meat consumption increases by one unit, Uric acid increases by 0.130 units. 

The regression equation is Uric acid = 1.517 + 0.130 (Meat consumption).

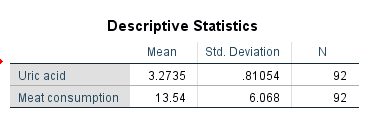
Data: Linear_regression_data.sav

“Rehoboth Academic Services” is a premium institute supporting PhD & Master’s Thesis since 2013. We offer editing, proofreading, paper preparation, statistical analysis,  formatting and plagiarism checking services. We have helped more than 10000+ research scholars in most of the subjects and universities across the globe in the last eleven years. We also conduct workshops on Art of Thesis Writing, Academic Integrity, Research Paper writing, Systematic Review writing, Increasing citation score, SPSS Foundation & Advanced, Jamovi, JASP, SmartPLS and SEM workshops. If you need our assistance please call + 91 9731988227, +91 9741871657.

Are you interested to attend our Workshops?

Click here to see our future workshop schedule…

Leave a Reply

Your email address will not be published.